How to Prove Procurement Software ROI (With Real Numbers)
In many organizations, procurement and AP processes don’t fall apart — they just pile up.
A spreadsheet becomes a system. A workaround turns into a policy. Vendor approvals still follow rules no one remembers creating. Everyone is doing their best, but over time, the process becomes harder to follow — and even harder to change.
Manual checks and ERP add-ons help hold things together, but they don’t fix the core issue.
That’s why we keep hearing the same questions:
Is this actually working? Is it saving us time or money, or just keeping the mess under control? And how do we calculate the ROI of procurement software?
These are the questions more teams are asking — and the answers more CFOs need.
Whether you’re making the case for automation or trying to replace a tool that isn’t delivering, this article will walk you through how to calculate procurement and AP software ROI, step by step. We’ll show you what to measure, how to find your real savings, and how to turn those numbers into a business case that earns buy-in.
Why measure procurement ROI and how to prove it
In dozens of recent calls with procurement and finance teams, one theme kept surfacing:
It’s not that leadership doesn’t think procurement is important. They recognize the importance of controlling costs, minimizing waste, and effectively managing vendors.
But what they often don’t see — and what procurement leaders struggle to show — is the quantifiable impact of that work.
How much time is really being saved by automating approvals?
What’s the actual cost of manual invoice matching?
Are compliance gains from a stricter PO process translating into financial results?
- “We’re using NetSuite, but approvals are still in Slack and Excel.”
- “We’ve got tools in place, but no real visibility into what’s being spent.”
- “It feels like a black box when I try to show what procurement is actually delivering.”
Without hard numbers, even smart and strategic procurement efforts can appear to be “back office admin” work. That’s why procurement teams often hit a wall when asking for more resources, better tools, or support to replace underperforming systems.
As one customer put it:
“Leadership wants hard numbers — not potential value.”
While the ROI of procurement automation is real, it’s rarely visible by default, especially in organizations that still run lean teams, use spreadsheets, and have scattered ERP add-ons.
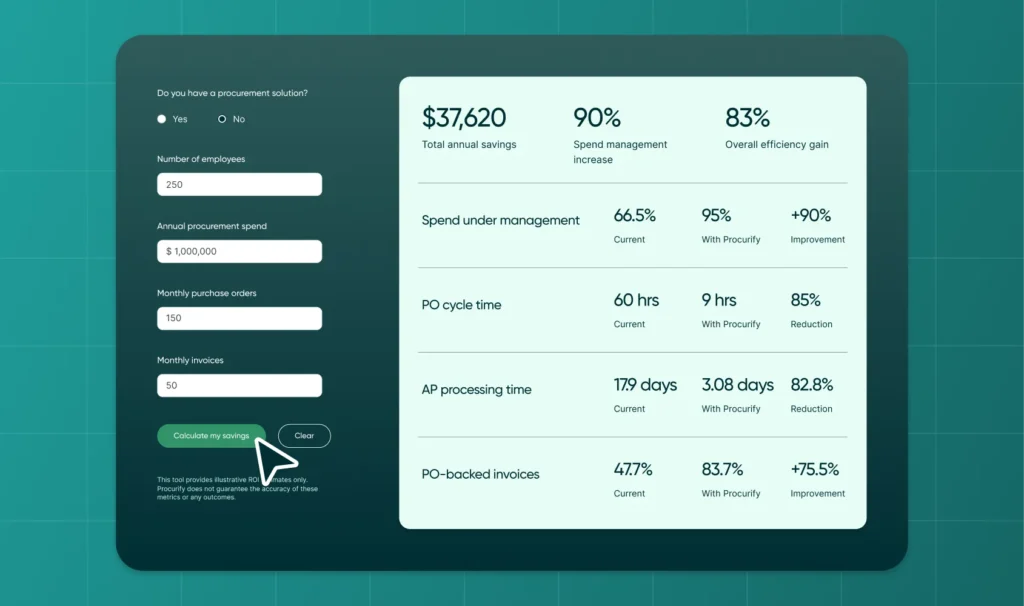
That’s exactly why we built the Procurement ROI Calculator.
To help teams put structure around the value they’re creating and turn operational wins into business outcomes, the CFO can sign off on. Whether you’re making the case to adopt a tool or prove your current one is worth keeping, it helps turn your day-to-day impact into measurable business value.
Quantifying the ROI in procurement and AP automation
Let’s break down the key value drivers and how they’re quantified in our calculator.
1. Cost savings from controlled spend
You can’t save what you can’t see. By bringing more spend under management (SUM), companies can:
- Unlock volume discounts and early-pay incentives
- Reduce maverick spend and unauthorized purchases
- Improve compliance with preferred vendors and contracts
Real example:
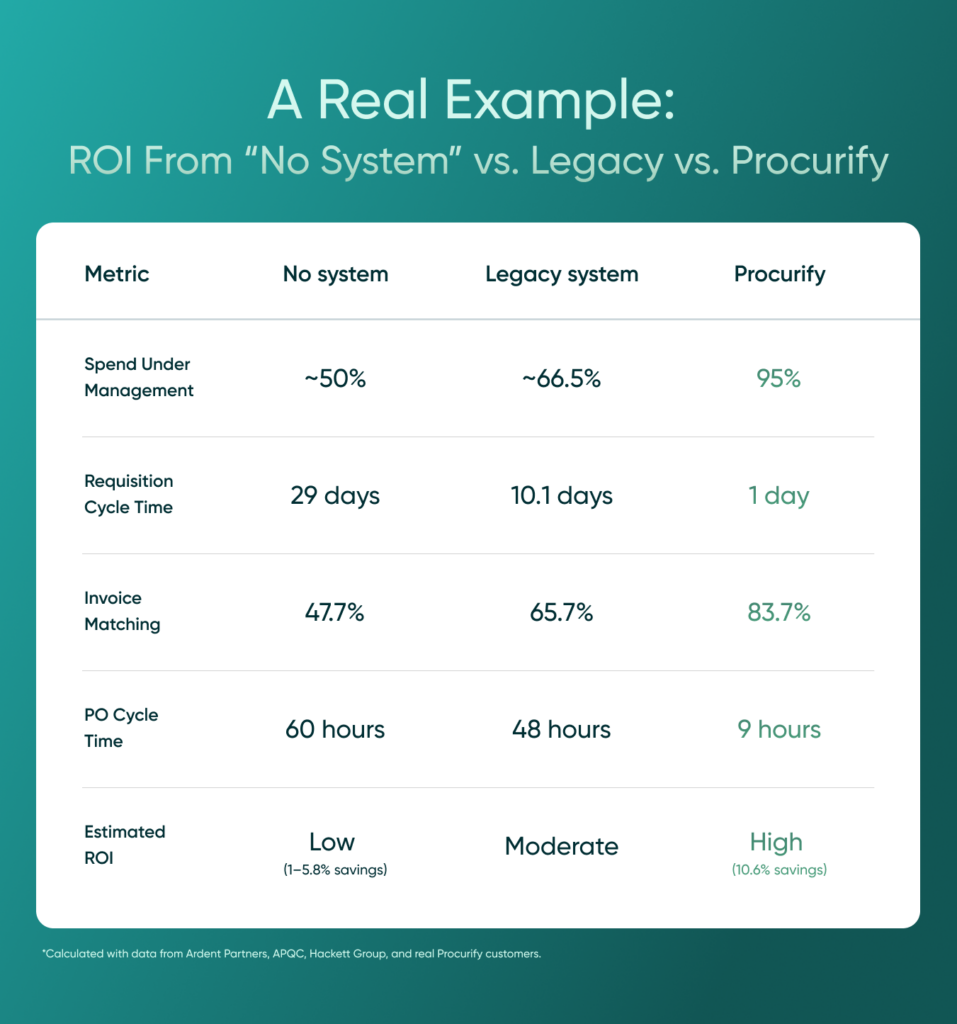
Moving from 50% to 95% SUM can increase your total savings percentage from 1–5.8% to 10.6% of indirect spend.
2. Time saved on purchasing and invoice workflows
Manual processes are time-consuming and inconsistent. Automating POs, approvals, and invoice matching frees up teams to focus on strategy rather than chasing paperwork.
Benchmarks:
- PO cycle times drop from 10–18 days to 1–3 days
- Invoice approvals improve from 60 hours to 9 hours
- Invoice matching rates increase from 47–66% to 83.7%
Multiply that by hundreds of transactions a month, and the time savings quickly translate to hard-dollar savings.
3. Invoice processing cost reduction
One of the top pain points from finance teams is the labor cost of processing invoices. The industry average is ~$10–$15 per invoice manually. With automation, that cost drops to $2–$5.
If you’re processing 500 invoices/month, that’s a potential savings of $30,000–$60,000 per year.
4. Strategic visibility and audit readiness
Proactive procurement tools let you:
- Track spend vs. budget in real time
- Catch anomalies and avoid duplicate payments
- Create cleaner audit trails for AP and compliance
Customer outcome:
One organization saved $2M and 34,000 hours by reducing cycle times and preventing errors across their purchasing process.
How our procurement calculator works
Our Procurement ROI Calculator lets you enter a few key data points:
- Annual spend
- Team size
- Volume of purchase orders and invoices
- Your current setup (manual, legacy, or modern)
Then it uses industry benchmarks to model your potential ROI across:
- Spend savings (via SUM and discounts)
- Efficiency gains (PO and invoice cycle time reductions)
- Risk reduction (from fewer errors and better controls)
How to Calculate ROI on Existing Procurement Software
We hear it all the time:
“We have a system, but we’re still chasing approvals in email and matching invoices by hand.”
or
“Our ERP module was supposed to help, but it’s clunky and people avoid using it.”
Many teams already have procurement software in place but still rely on manual workarounds. The reason? A lot of legacy or enterprise tools like Coupa weren’t built with modern teams in mind. They’re hard to use, difficult to customize, and often require workarounds just to get through the day.
Even if you’ve invested in a tool, you might be missing ROI if:
- Approvals still happen in Slack or email
- Budget owners don’t trust the system or use it
- Reports can’t be pulled without Excel gymnastics
- Visibility into spend is delayed or incomplete
- Invoice processing is still a back-and-forth effort
This is especially common with ERP add-ons. They’re technically “in place,” but adoption is low and workflows are still fragmented. You don’t need to start from scratch—but you do need to measure what your current tool isn’t delivering. If the system isn’t saving time, improving visibility, or helping you control spend, it’s not driving ROI.
Use the calculator to build a CFO-ready business case
Whether you’re a procurement manager, AP lead, or FP&A analyst, you’re often the one doing the legwork to justify spend. The calculator helps you:
- Get clear, benchmark-based ROI projections
- Speak your CFO’s language (savings %, efficiency, payback period)
- Make a case for investment or replacement
One finance lead said it best on a recent call:
“If I can walk into a meeting and show we’re sitting on $100K in lost savings, it’s not a hard sell.”
Try the procurement ROI calculator
It takes 3 minutes to run the numbers. You’ll walk away with:
- A customized ROI estimate
- Spend and time savings projections
- Clear justification for your next internal budget request
Get the calculator now.
FAQs
Q: How do I calculate ROI for procurement software?
A: Measure indirect spend, current workflows, time spent on POs and invoices, and current system setup. Our calculator does this automatically using industry benchmarks.
Q: Is procurement software worth it if I already have a system?
A: Yes—if your current tool isn’t driving automation, visibility, and cost reduction, the ROI may be lower than it should be.
Q: How can I justify procurement software to my CFO?
A: Use a data-backed tool like our ROI calculator. It shows savings and efficiency metrics in language your CFO understands, helping you get buy-in with confidence.

Preview AI Intake for Orders
Take the product tour to see how the new intake experience works.


