Procurement KPIs: How To Measure What Actually Matters
We’re all measuring something—but are we measuring the right things? Too often, teams track procurement metrics without knowing the real story behind them. Ask anyone in procurement, and most will admit they still struggle to measure what truly drives value.
As spend management becomes more complex and decentralized, tracking the right procurement KPIs has become increasingly elusive. And tracking the wrong ones? That shows up in unproductive workflows, risky decisions, and little control over costs.
So what happens when you track the right KPIs? And what are the right ones, anyway?
In today’s digital-first, cost-conscious environment, procurement roles, responsibilities, and expectations are changing fast. If your team isn’t using procurement KPIs to guide decisions, you’re likely leaving value on the table.
The best organizations don’t just measure—they use metrics to optimize performance. This article explores why procurement KPIs matter and which seven you should be tracking.
Why procurement metrics are important
As we move into 2026, the urgency around modernizing procurement is only growing. Procurement is no longer viewed as a cost center; it’s a strategic function that directly impacts operational agility, supplier resilience, and financial health. The GEP Outlook 2025 report highlights a key shift: metrics that once focused exclusively on savings are now being replaced by ones tied to workflow resilience, innovation, and real-time decision-making assisted by AI.
Today’s leading organizations have to respond to change as it happens. That means the days of quarterly metric reviews and backward-looking reports are over. In their place, real-time budget visibility, AI-powered procurement workflows, and automated invoice processing are becoming the new normal. These AI-enhanced software systems can categorize and match invoices automatically, flag anomalies before they become issues, and optimize spend strategies.
For example, rather than simply tracking how long a purchase order took to process last month, teams are using AI to ask spend questions in real time, forecast delays based on historical data, and automatically route approvals based on budget thresholds.
These digital upgrades are a fundamental shift in mindset across both procurement and finance. AI-assisted accounting and procurement are merging to form a continuous feedback loop of insights, where decisions aren’t just faster—they’re smarter, more informed, and increasingly automated. KPIs and metrics are no longer just for reporting, they’re levers for a more robust business operation.
Want a practitioner’s view on how organizations have historically benchmarked procurement KPIs? Read this expert interview with APQC’s Marisa Brown for a foundational perspective on cost, cycle time, and digital adoption metrics.
Three key forces driving this adoption:
1. The rise of SaaS and digital buying
The proliferation of SaaS tools and subscription-based services has decentralized procurement. Employees across departments are purchasing software, licenses, and services on demand. Without centralized oversight and automated tracking, spend visibility disappears and along with it, the ability to make strategic decisions based on accurate data. Procurement now touches every department. Employees want easy-to-use, intuitive tools and they expect the ability for instant purchases. This means managing more purchase requests, more vendors, and more spend without visibility.
2. Pressure for spend transparency
Boards, CFOs, and regulators expect granular insight into where and how every dollar is spent. In a world of shrinking margins and rising stakeholder expectations, reactive procurement is no longer acceptable. Procurement metrics must provide actionable insights before spend happens, not weeks later. Executives aren’t just asking, “Are we on budget?”
They want answers to questions like:
- Are we overspending with non-preferred suppliers?
- Which departments or locations are driving the most off-policy spend?
- How much spend is tied up in slow approval workflows?
- Where are we exposed to vendor risk or bottlenecks?
- Are we compliant with internal policies and external regulations?
The problem? Fragmented workflows and outdated ERP modules often make these answers difficult to answer if you can’t quickly pull the right metrics.
3. Vendor accountability in uncertain markets
Supply chain disruptions, inflation, and changing geopolitical procurement strategies have made vendor management a board-level concern. It’s no longer enough to know who you’re buying from—you need to know how well they’re performing and whether they’re strengthening or weakening your operational resilience.
That means going beyond contracts and pricing. To truly enforce vendor accountability, organizations need visibility into delivery timelines, fulfillment consistency, and how often employees are using preferred suppliers. Without that insight, it’s difficult to distinguish isolated issues from systemic ones—or to build a supplier strategy grounded in dependable performance.
This same visibility also helps identify whether internal procurement practices are contributing to supplier unreliability. For instance, when employees frequently bypass approved vendors or processes aren’t tracked centrally, it becomes difficult to enforce standards or hold partners accountable.
In uncertain markets, vendor accountability is critical for organizations to gain a measurable edge in continuity, cost control, and supply chain confidence.
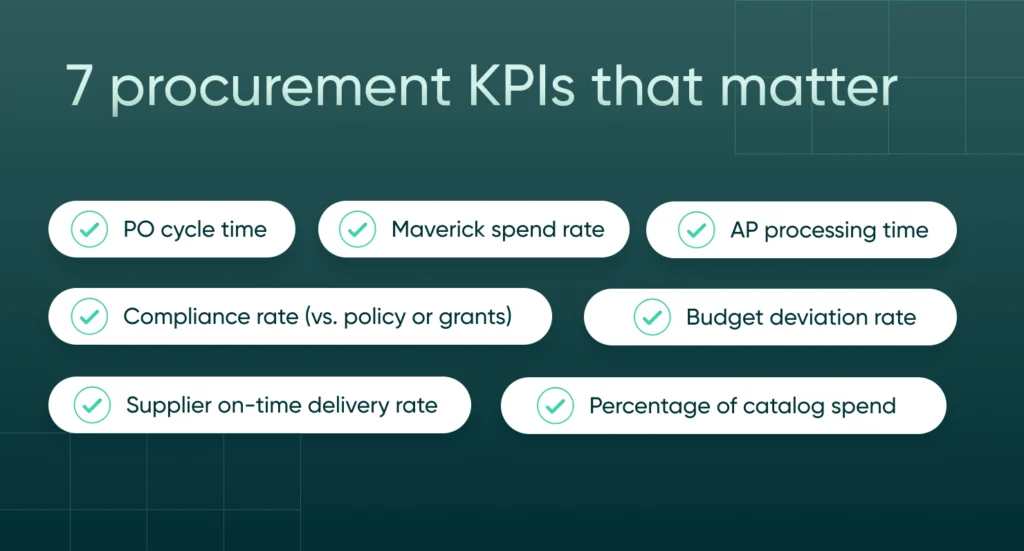
7 procurement KPIs that matter
1. PO cycle time
Why it matters:
Long purchase order cycles delay projects, increase rushed last-minute purchases, and create unnecessary costs. Faster cycles improve operational flow and vendor relationships.
What it reveals:
This metric shows how efficiently purchase requests move through your process—from initial request to final PO. High numbers often point to bottlenecks in approvals, unclear workflows, or disconnected systems.
What it enables:
With visibility into PO cycle times, you can identify delay points by department, improve accountability, and build a case for automation where it’s most needed.
2. Percentage of catalog spend
Why it matters:
Catalogs streamline purchasing. They reduce manual approvals, promote preferred vendor usage, and ensure consistent pricing and compliance.
What it reveals:
This metric shows how often employees follow approved buying paths. Low percentages often signal that the system is hard to use, the right suppliers aren’t included, or employees are bypassing controls.
What it enables:
By optimizing catalog design and policy enforcement, you can increase adoption, reduce maverick spend, and bring more purchases under centralized control.
3. AP processing time
Why it matters:
The faster invoices are processed, the stronger your cash flow, and the fewer headaches from vendors waiting to get paid.
What it reveals:
This highlights how efficient and integrated your accounts payable process is. Long processing times typically reflect manual handoffs, inconsistent invoice matching, or overloaded approvers.
What it enables:
With insight into bottlenecks, you can streamline approvals, prioritize high-volume invoices, and even unlock early-payment discounts.
4. Maverick spend rate
Why it matters:
Off-policy purchases bypass controls, complicate budgeting, and weaken supplier leverage.
What it reveals:
High maverick spend suggests either that employees are unaware of policy, or that the purchasing process isn’t meeting their needs. It often reveals policy gaps or usability issues in your system.
What it enables:
This insight can guide improvements in training, user experience, and enforcement, turning rogue spend into compliant, trackable activity.
5. Supplier on-time delivery rate
Why it matters:
Late deliveries can delay projects, increase rush costs, and undermine trust between teams and vendors.
What it reveals:
This shows how reliable your suppliers are over time. Poor performance could stem from vendor issues or internal forecasting breakdowns.
What it enables:
Tracking this rate allows you to hold vendors accountable, renegotiate terms, or consolidate with partners who consistently deliver on time.
6. Budget deviation rate
Why it matters:
Budget deviations often go unnoticed until they become serious problems. This KPI helps teams catch issues before they escalate.
What it reveals:
This identifies which departments or projects are drifting from budget—and whether those are isolated incidents or recurring patterns.
What it enables:
Armed with this insight, you can enforce budget-aware approvals, flag at-risk projects earlier, and improve forecasting over time.
7. Compliance rate (vs. policy or grants)
Why it matters:
High compliance rates signal strong financial discipline. They reduce audit risk and show stakeholders that controls are working.
What it reveals:
This tracks whether teams are following procurement policy, or if significant spend is happening outside approved workflows or grant guidelines.
What it enables:
Monitoring compliance helps pinpoint where policies are breaking down, where training is needed, or where the system itself may need improvement to support adoption.
How to track these KPIs automatically
Tracking procurement KPIs manually is slow, inconsistent, and often inaccurate. Most ERPs weren’t built to track operational metrics like PO cycle time or catalog adoption in real time, and spreadsheets require hours of cleanup before they tell a complete story.
Here’s what you actually need in place to track these KPIs automatically:
1. System-level timestamps for every step
- To track PO cycle time and AP processing time, your system needs to record every event—request submitted, approved, PO issued, invoice received, payment made.
These timestamps should be automatic (not user-entered), so you can calculate cycle times without guesswork.
2. Budget-aware approval workflows
- To reduce budget deviation, approvals must be tied to live budgets.
- The system should show approvers whether the request fits within their current budget before they approve it.
3. Catalog integration and policy enforcement
- To track catalog spend and estimate maverick spend, you need catalogs embedded in the purchasing process.
- The system should flag or restrict purchases made outside pre-approved vendors or categories.
4. Vendor consolidation and performance tracking
- To track metrics like compliance and on-time delivery, vendor data needs to live in one place—not scattered across emails or spreadsheets.
- The system should track which vendors are used, how often, and how reliably they deliver.
5. A unified spend dashboard
- You need a central dashboard that automatically pulls and displays these metrics across teams, departments, and timeframes.
- This gives procurement, finance, and leadership one view of what’s working and what’s not.
To track these KPIs automatically, you need a platform that connects purchasing, approvals, and payments in a single system—with real-time data, not reports built after the fact.
If your current tools can’t do that, you’re not just missing insights—you’re missing opportunities to improve.
KPI benchmarks by industry: where do you stack up?
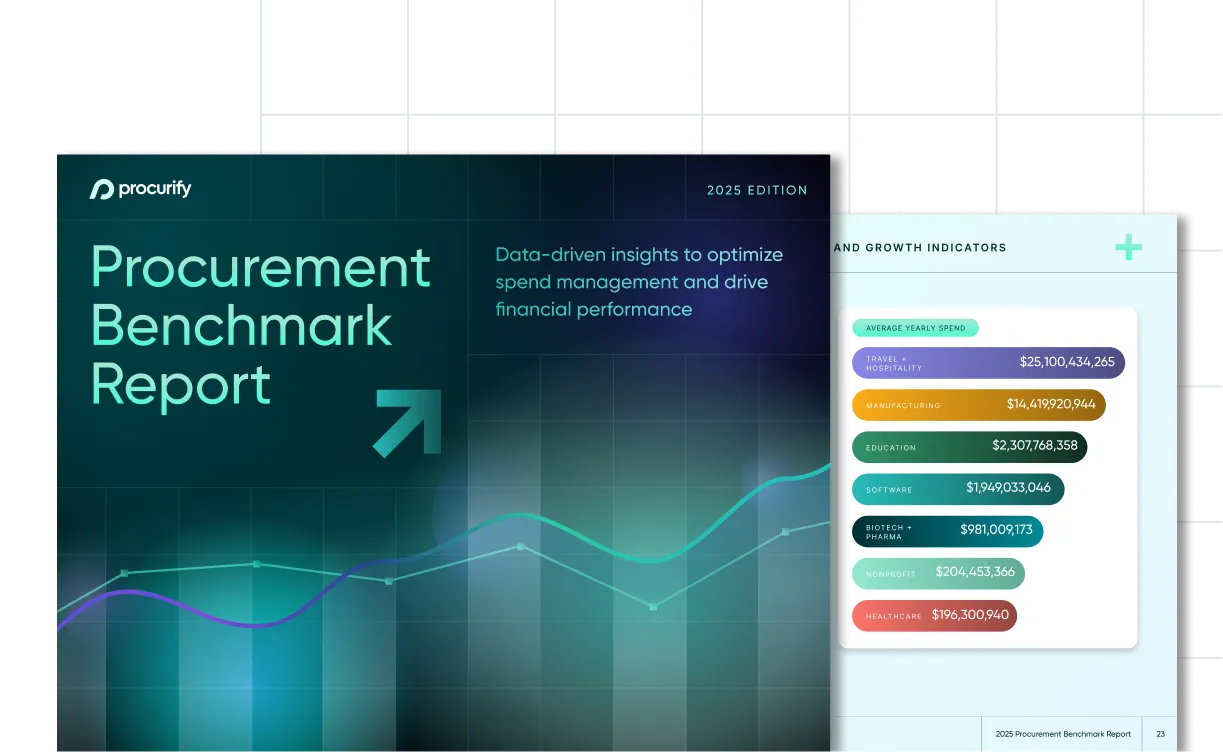
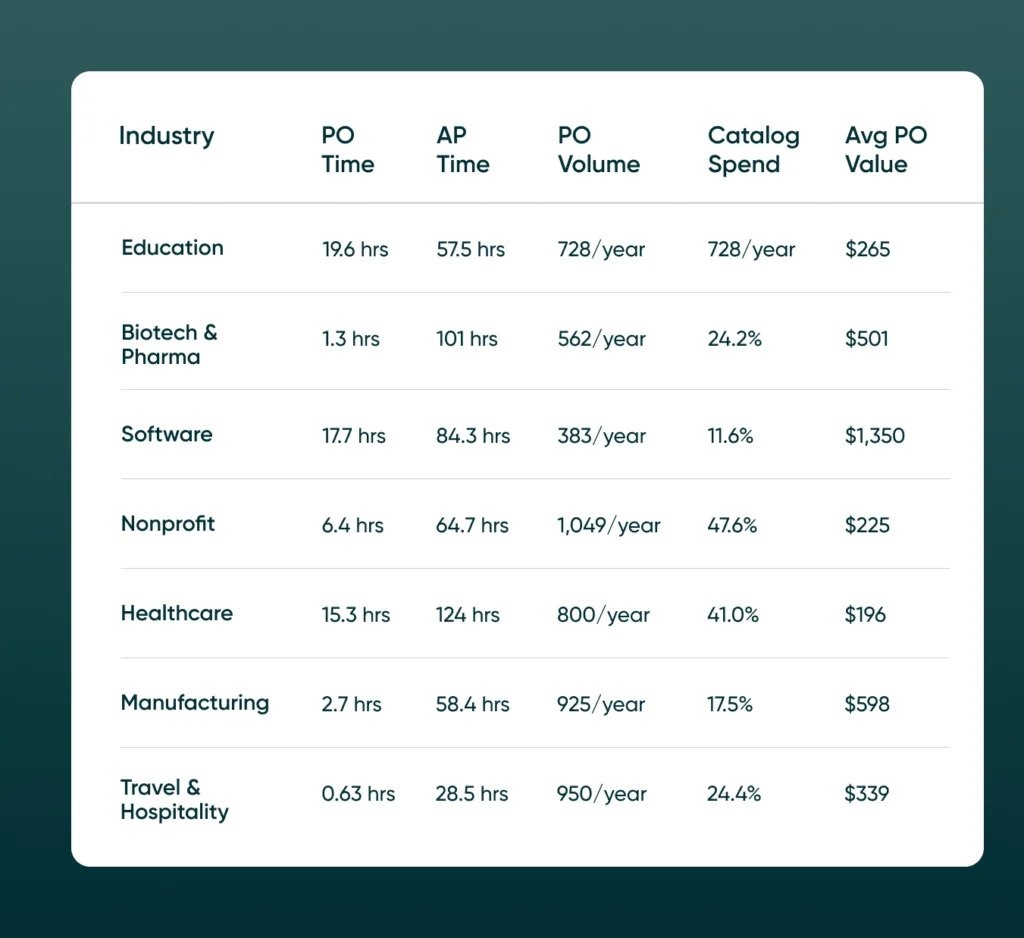
Drawn from Procurify’s 2025 Procurement Benchmark Report, which analyzed over $20 billion in spend across industries, these seven metrics are widely accepted procurement metrics that reveal patterns like vendor fragmentation, catalog usage, and process delays.
These metrics provide a practical framework to measure and improve procurement performance within your organization.
How to use this procurement data
This benchmark data is more than just a snapshot — it’s a diagnostic tool. Here’s how procurement and finance leaders can apply it:
1. Compare your internal metrics to your industry
- Start by identifying your own PO cycle time, AP processing time, catalog adoption rate, and average PO value.
- Ask: Are we faster or slower than our peers? Are we handling more transactions, but with lower efficiency?
2. Spot red flags
- A high PO cycle time (e.g., >15 hrs) could indicate bottlenecks in your approval chain or a lack of automation.
- Low catalog spend (<20%) often signals off-policy buying and inconsistent vendor usage.
- AP processing times above 80 hours suggest manual invoice handling and a disconnect between purchasing and accounting.
3. Identify areas to automate or streamline
- If your volume is high but PO values are low (like Nonprofits), automation can reduce administrative burden.
- Long AP times? Consider workflow tools that auto-match POs, invoices, and payments.
- Low catalog usage? Revamp your vendor onboarding or make catalogs easier to navigate.
4. Build a business case
Use these benchmarks to quantify inefficiencies.
Example: “We’re processing 950 POs/year like our peers in Travel & Hospitality — but our PO cycle time is 10x slower. That lag adds up to X hours of lost productivity and potential delays.
Bonus: Try this ChatGPT prompt to evaluate your procurement performance
Prompt: “Compare these internal procurement KPIs to industry benchmarks. Highlight where we’re underperforming and suggest 3 specific process improvements we could make to reduce delays, increase catalog usage, or improve supplier performance.”
Then paste in:
- Your PO cycle time
- AP processing time
- % of catalog spend
- Average PO value
- Any relevant vendor performance data
This helps your team or leadership quickly identify blind spots and discuss where automation or policy changes can deliver ROI.
Want to fully understand where your team stands? Download the full report here or talk to us now.

2025 Procurement Benchmark Report
Powered by $20B+ in proprietary data you won’t find anywhere else.


